Over the past few years, the world's best entrepreneurs and investors have released valuable articles about SaaS startups. Christoph Janz wrote about funding, Neeraj Agrawal wrote about growth, Jason Lemkin wrote about… well, everything.
One thing, in particular, makes those readings great: they contain numbers and metrics that are helpful to understand what a successful startup looks like at each step of the growth journey.
So what happens when you put those numbers together in a spreadsheet? Can you paint the big picture of a SaaS startup in Silicon Valley, from inception to IPO?
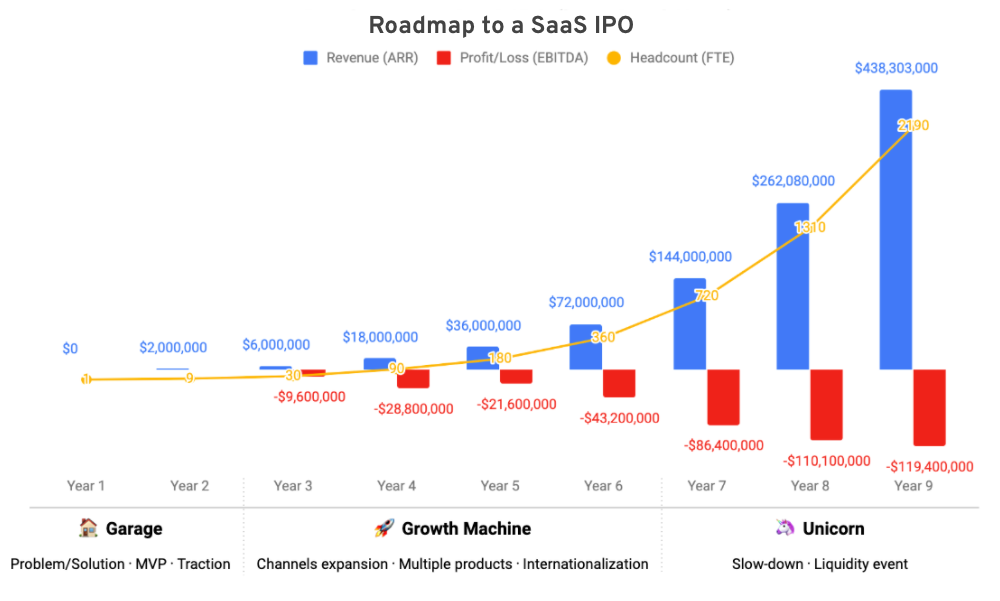
Yes, and here is the result:

This article will walk you through the different steps that lead us to the chart above. Bear in mind that the numbers presented here are orders of magnitude rather than hard rules. They mostly apply to Silicon Valley-based, VC-backed, SaaS startups. Take them with a grain of salt :)
Table of Contents
⏱ Timeframe: 6 years to a SaaS unicorn, 9 years to a SaaS IPO
Starting a startup is a long-term game.
Steve Blank, Morgan Brown, Brian Balfour, and Reid Hoffman have all described their own vision of the startup lifecycle. When looking at it, we notice that a successful startup goes through 3 phases during its life:
- Garage — Going from problem to product-market fit
- Growth Machine — Expanding channels, product lines, and geographies
- Unicorn — Stabilizing and becoming liquid (IPO or acquisition) above a $1 billion market value

In 2016, the TTU (time-to-unicorn) was stable at 6 years in the US, courtesy of the good people at fleximize. A unicorn, as originally defined by Aileen Lee of Cowboy Ventures, is a tech company, public or private, that reaches $1 billion in valuation. More recent definitions exclude public companies from the scope for obscure reasons. Regardless, joining the blessing of unicorns remains a big deal, if not the mark of success for most founders.

What about SaaS IPOs, then? Data from Pitchbook suggest a median time of 8.2 years between first VC funding and IPO. Throw in an extra 12 months of existence before the first funding round (purely speculative), and we are looking at a TTI (time-to-IPO) of nine years, give or take. So much for the quick buck!

📈 Growth: triple twice, double thrice, then 82% growth persistence
In a 2015 article, Neeraj Agrawal suggested that SaaS growth follows a clear pattern.
First, you establish a product-market fit. First, you establish a product-market fit (PMF) either instantly or within up to two years. Second, you reach $2 million in annual recurring revenue (ARR), which is another one to two years. From there on, things become pretty predictable and Neeraj puts forward the T2D3 rule (i.e. revenue triples twice then doubles thrice in the 5 following years).

Bottom line: you should pass the $100 million mark in ARR six to nine years after starting.
- What about after that? According to Rory Driscoll of Scale Venture Partner, “for a best-in-class SaaS company, the growth rate for any given year is [82] percent of the growth rate of that same company in the prior year”.
In a nutshell:
- ARR: PMF → $2M → $6M → $18M → $36M → $72M →; $144M → $262M → $438M
- Growth rate: 0% → 200% → 200% → 100% → 100% → 100% → 82% → 67%

🤑 Profit at scale = 40% — growth rate
Now that’s the top line is clear, let’s look at the bottom line.
In the early days, it is safe to assume that the company grosses in little to no profit. Once you are above $50M ARR, however, things change.
In a 2015 article, Brad Feld formulates the 40 percent rule: your growth rate + your profit should add up to 40%.

(The graph is originally from Pacific Crest Group, found via this article by Dave Kellog. Kudos to both of them).
We will assume that you run your infrastructure in the cloud, so profit = EBITDA. But as Feld points out, reality may be more complex if you run your own infrastructure.

💰 Funding: Seed, Series A, Series B, and then some
Fundraising also follows patterns. Based on Chris Janz’s world-famous napkin, a SaaS startup in 2018 coud expect to raise:
- Seed round at $0–1M ARR and 0% annual growth
- Series A at $1–1.5M ARR and 200% annual growth (x3)
- Series B at $5M ARR and 150% annual growth (x2.5)

Let’s assume that you raise funds every 18 months for seed, series A and B. After that, things become blurry.
Janz also offers typical valuations and round sizes in his article, so you can easily assess whether your $10 million ask for a seed round is realistic (hint — it’s probably not).

🚪 Exit: sell at $1 million or $10 million ARR, or IPO at $100 million ARR
As your startup grows, you may be presented with opportunities to sell.
Perhaps a competitor with deeper pockets wants to clear up space — Hired and Match.com are really good at that. Or perhaps a large corporation will see a “strategic fit” with your team, product and/or clients. Think GM with Cruise or Microsoft with Linkedin. Most of the time, it’s both.
These opportunities, however, are not equally distributed during the startup lifecycle. According to Jason Lemkin, there are two local maxima for an acquisition:
- At $1 million ARR, when you are “hot and cheap”.
- At $10 million ARR (and decreasing until $100M ARR), when you become meaningful but still affordable.

So if you feel like you won’t make it to the next milestone, it may make sense to sell at a local maximum. Or is there an alternative?
If you want to go big, you want to IPO. But what makes a SaaS IPO? A successful IPO follows a line that O'Driscoll calls the “Mendoza line”, with ARR on the x-axis and forward growth rate on the y-axis.

In short, this is what your metrics should look like before you go public:
- $100 million ARR
- 25% forward growth rate
These numbers are incredibly hard to achieve, and that’s what the author calls “the realistic low bar to IPO”. Unsurprisingly, there have been only 21 tech IPOs per year over the last five years.

To put it in perspective, let’s look at what it means in terms of sales.
👨💼 Sales: $100M ARR = ARPA x number of customers
Our target is $100M ARR. Now, your ARPA (average revenue per account) is a constant by definition. So you can derive the number of clients that you need following Chris Janz’ chart.
At $10 million ARPA, you need 10 clients to IPO. At $1 million ARPA, you need 100 clients to IPO. … At $100 ARPA, you need 1 million clients to IPO.

Say you address a market of “prosumers” as Wix, Typeform, Evernote or Mailchimp do. You charge on average $100 per year per customer. Not only do you need 1 million paying customers to IPO, but you also need to add 250,000 more customers next year (and/or upsell by as much).

Still looks like something feasible? Then let’s look at how many people it takes to build this kind of company.
👩💻 Headcount: $200,000 ARR per employee
The headcount increases as you move forward through the startup lifecycle.
Conveniently enough, Tom Tunguz from Redpoint has already done the math for us. In SaaS companies at scale, the average revenue per employee stands at $200,000.

True, this is for 2012 and this is for companies at scale. If you have better numbers, hit me up and I’ll update them!
At the end of the day, that is what our roadmap to a SaaS IPO looks like.

Keep in mind that this is “unicorning your way to $100M ARR” i.e. it’s the (supposedly) perfect trajectory. Obviously, it’s a super-wide generalization. Not one startup will follow this roadmap strictly, and counterexamples abound. But frameworks are useful, and hopefully, this one will be useful too.
🙏 Sources
- Reid Hoffman — Blitzscaling
- Morgan Brown — 5 phases of the startup lifecycle
- Steve Blank — What do I do now
- Brian Balfour — Traction VS Growth
- Fleximize — The Speed of a unicorn
- Adley Bowden — VC investing still strong…
- Neeraj Agrawal — The SaaS travel adventure
- Rory O’Driscoll — Understanding the Mendoza line for SaaS growth
- Brad Feld — The rule of 40% for a healthy SaaS company
- Dave Kellogg — The SaaS rule of 40
- Christoph Janz — The SaaS Funding Napkin 2018
- Jason Lemkin — Acquisition: If you do sell,…
- Karen Firestone — Ordinary investors are the real losers…
- Christoph Janz — Five ways to build a 100…
- Tom Tunguz — Revenue per employee benchmarks…
